




Subscribe to Newsletter
Enter your email address below and subscribe to our newsletter

You are the investigator
SitDeck OSINT: A guide with 6 practical workflows
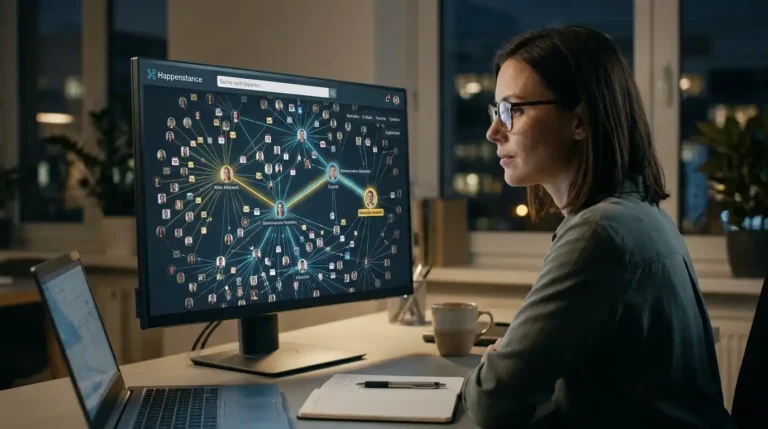
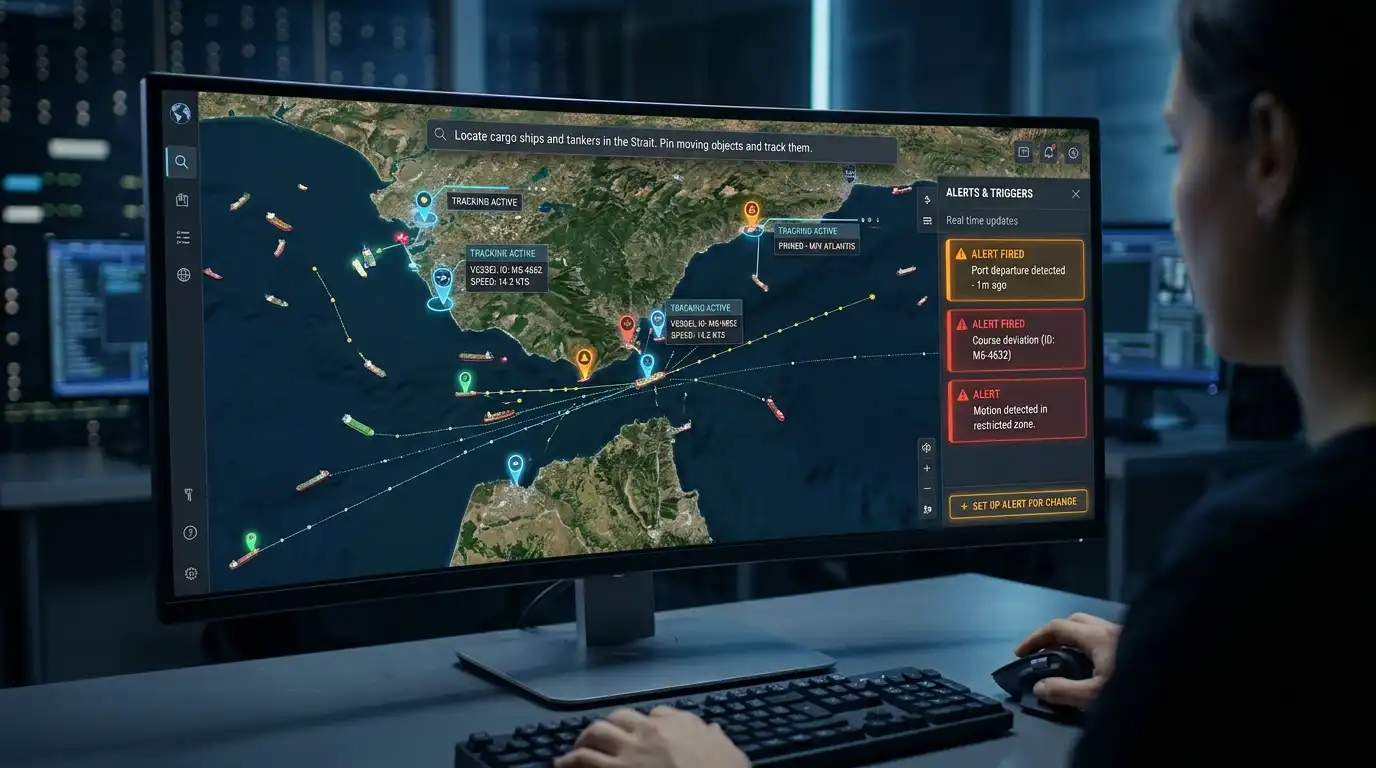
A news report about a port closure, an earthquake, or an internet outage is easy to find. Then the tab chaos usually begins: opening the map, searching for reports, comparing timestamps, and finding the right data source again. SitDeck It brings many of these steps to one screen. You create a dashboard, open events on the map, and from there move on to the next research question.
This is especially worthwhile if you want to pursue a topic for an extended period. Instead of visiting the same pages each time, you create a dedicated workspace for it. Here we show you six practical ways to do this. SitDeck for OSINT to get started: from the first deck to your own alarm.
SitDeck is a browser platform for publicly accessible information. In Ops Center Your dashboards are located here Decks They're called. A deck consists of widgets: small views for news, weather, cyber alerts, flight movements, and other topics. In addition, there's an interactive map, the Case Builder for targeted research and a AI Analyst, which summarizes information.
In the publicly accessible Data catalog We've compiled 319 entries in 38 categories. You don't need to know them all. To start, one topic, one region, and a few relevant widgets are enough.
Open app.sitdeck.com and log in. If you don't already have an account, take the next step. Create account for registration. Account help This describes the confirmation via email; no credit card is required for free registration.
Let's say you want to track what's happening in a specific port region. For that, news, weather, maritime warnings, and a map are more helpful than a screen full of random data.
Start with a suitable deck template, for example for maritime observation, and customize it. The process is described in the Dashboard Instructions described:
This is how you create your own observation platform: reports on one side, geographical context next to them. Decks save automatically according to the instructions. For a different topic, you create another deck and switch between them using the selection in the top toolbar.
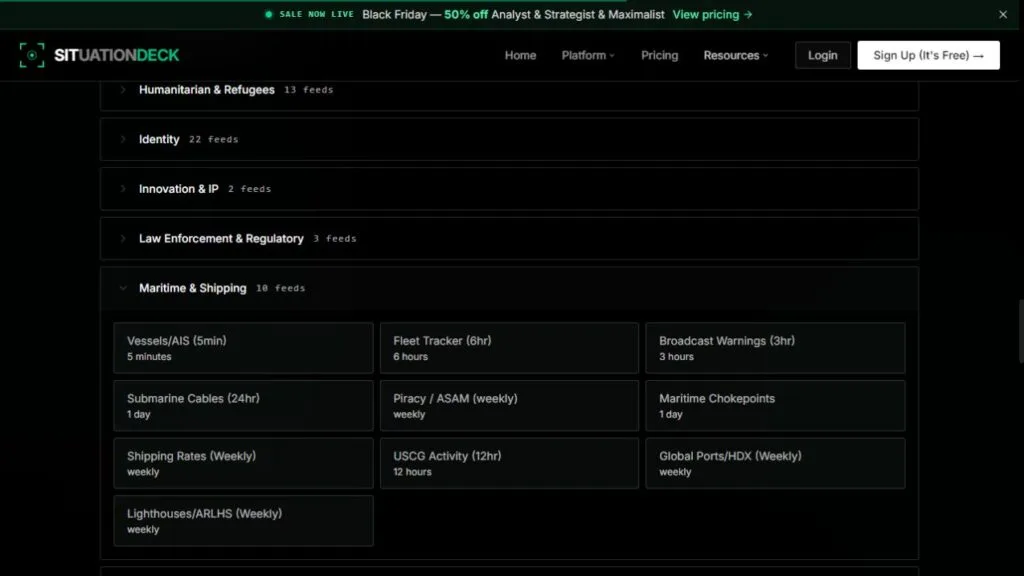
You can explore which sources are relevant to your topic even before registering. Open the website. Data → Maritime & Shipping. There you can see, for example, AIS, maritime warnings and port information along with the specified retrieval frequency.
Good to know: Multiple widgets can display the same initial report. Use the additional view for an overview and open the original article if you find something interesting.
You read about an earthquake and want to know where it is and what is nearby. That's exactly what the combination of map, event layer, and measurement tool is useful for.
The most important controls are called Jump, Locate, Track and Annotations. For this introduction, you will first need Jump for navigation and Annotate for drawing and measuring. The map help explains these functions.
time and updated.This allows you to spatially categorize a report and specifically search for information from the affected area. For your notes, the event link, time, magnitude, and measured distance are sufficient to start.
Important when reading the map: Distance alone doesn't tell you anything about damage. With satellite images, the date they were taken is also important. If you're adding FIRMS heat signals, keep in mind that industrial facilities or volcanic activity can also generate such signals.
When dealing with an unfamiliar website, you might want to know: How long has the domain existed, what does it point to, and what did the site look like previously? A small research chain can be built to answer these questions, using registration data, DNS records, and archived images.
You can find it in the public catalog under Network & Domain among other things RDAP / WHOIS Registries, Cloudflare DoH, RIPEstat and Certificate Transparency / crt.sh. The Wayback Machine and Common Crawl are also listed. Case Builder This feature is intended for merging individual queries and their results. We were unable to examine the exact interface of the respective domain tools without an account.
Here's how to use these access points for a specific question:
The result is a brief website history: registration, infrastructure, and published content with their respective dates. If a company name appears, you can continue your search with a relevant registry. SitDeck suggests, for example, Companies House, GLEIF, OpenCorporates, and SEC EDGAR. Select by country and question, and compare existing registry numbers.
Usernames can also be used as a further clue: The catalog contains WhatsMyName-related accounts and various profile queries. Compare found profiles using public links and content before attributing them to the same person.
The most common stumbling block: A shared IP address or the same username is a good starting point. Additional information, such as reciprocal links, registration numbers, or a matching legal notice, helps in identifying the source.
A website isn't loading, outage reports are circulating on social media, and you want to see if the problem is widespread. Create a dedicated deck with relevant cyber widgets for this purpose.
The Widget Help describes the cyber domain. The catalog reviewed includes, among other things... Internet Outages/IODA, BGP Alerts/RIPE, OONI and Cloudflare Radar. This allows you to juxtapose different perspectives on a problem.
Add suitable widgets via the Plus sign Add it and open its configuration. Limit the view to the region or network, if the respective filter allows it. Select a common time period for your comparison and note the time zone.
First, determine when the anomaly begins. Then, compare this to see if any routing or traffic signals appear at a corresponding time. Simultaneously, look for a statement from the affected provider. This will give you a useful timeline: initial reports, visible data signals, and the operator's explanation.
If, instead, it concerns a reported security vulnerability, work with the CVE identifier Next. Check the product and version in the manufacturer's instructions. An entry in the CISA-KEV catalog helps with classification because it records known exploitation. CISA describes its use for prioritization in the JCDC Playbook, Appendix D.
Keep the cause open for now: An outage can have various causes. The collected signals will help you narrow it down; however, you need additional evidence to confirm the claim of a „cyberattack“.
Once your deck is complete, the AI Analyst can help you with the review process. Open the chat via the toolbar or with... Ctrl/Cmd + K. Loud AI Guide It appears in the right sidebar and provides answers with source references.
Ask a short, clearly defined question. „What’s happening in the world right now?“ quickly leads to a general overview. A more practical approach is to specify a location, time period, and desired output format. For example, in English, as outlined in the instructions:
Summarize reports about internet disruptions in Germany during the last 24 hours. Give me a short timeline with event times in UTC and links to the original sources. Mark conflicting reports and missing information.
This is a template for your own query. With such a timeline, you can then open the most important sources and follow up on the messages. It's better to ask specifically about one open issue rather than trying to cram five topics into one message.
For longer observation there Situation Reports on a topic and Area Reports for a marked area. Both are paid features. Daily Intelligence Briefing In contrast, this is a general daily overview for all users. It doesn't have to match your personal deck.
If you prefer exploring connections, then Event Nexus Another option: choose a starting event, open suggested connections, and follow interesting branches. To begin, I would first address a clear chat question and add to the graph later.
To keep the chat useful: Check the sources behind the key statements. AI can be wrong; furthermore, a new conversation starts automatically, without remembering the previous one. Multi-part requests can consume additional message allowances.
Have you found a topic you'd like to pursue further? Then setting up a targeted alert is the next step. Alert Instructions describes the route via the left sidebar:
A simple rule is sufficient to start. If too many irrelevant messages appear, refine it with additional conditions or exclusions. Observe which matches actually occur before adding further rules.
According to the dashboard help, you can access your finished deck via Share Share as a read-only link. Under Export → Screenshot The view can be saved as an image. This is useful for a quick summary within the team. CSV export is also documented and described as subject to a fee; its exact current pricing structure remained unclear in the reviewed information.
Pay attention to the frequency: In the free plan, alerts are checked daily. Therefore, a fast data feed doesn't guarantee immediate notification. Also, check what notes and information your deck contains before sharing.
It's enough to try it out. hobbyistThe free version includes a dashboard, widgets, a map, and three daily checked alerts. The observed pricing table also listed ten AI messages per month. Paid plans are available for more frequent alert checks, more chat functionality, and additional features.
The following overview shows the regular monthly prices and the quotas visible in our research. Source: SitDeck Pricing, as of November 11, 2026.
| Tarif | Regularly per month | AI news per month | Custom alerts and check frequency |
|---|---|---|---|
| hobbyist | $0 | 10 | 3, daily |
| enthusiast | $9.97 | 30 | 15, hourly |
| Analyst | $19.97 | 60 | 50, described as „real-time“ |
| Strategist | $39.97 | 250 | 250, „Real-Time“ |
| Maximalist | $99.97 | 500 | 500, „Real-Time“ |
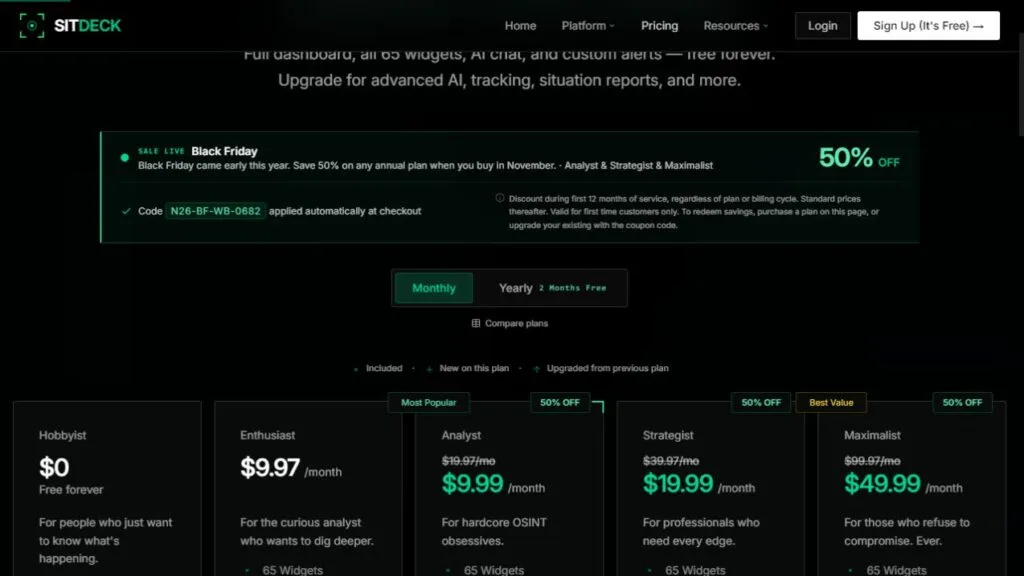
During the review, additional promotional prices of $9.99, $19.99, and $49.99 appeared for Analyst, Strategist, and Maximalist tiers. The information regarding the billing cycle was inconsistent; taxes and the final checkout price were not verified. Therefore, compare the actually selected subscription period before booking.
Also pay attention to the specific tool allocation: Case Builder advertises 153 tools, but the pricing cards list 100, 111, or at most 125 included tools. Older pages also show different AI quotas. Before upgrading, it's worth checking the availability of a specific research tool in your account.
Choose a topic you're already following. Build a small deck, open an interesting news item on the map, and work your way to its original source. If this process helps you, add an alert. Then, use the AI Analyst to automate the initial screening process.
For each useful source, a link, the date, and a sentence explaining why it's important are sufficient. This gives you a starting point for your next visit and saves you from having to piece together the research from scratch. If you're still lacking the basics, our introductory guide will help. OSINT for Beginners.
A brief note regarding confidential research: SitDeck is a cloud service. Privacy Policy This includes usage data, Google Analytics, and processing in the USA. Handle confidential case information with appropriate care. Terms of Use Neither error-free data nor reliable alarm delivery is guaranteed.
A notice: For this article, the publicly accessible pages, the data catalog, and the linked documentation were reviewed. No independent test was conducted in the logged-in area. Last updated: November 11, 2026.
Hashtags:
#SitDeck Case Builder; #OSINT Dashboard; #SitDeck Free; #SitDeck Pricing; #Event Nexus OSINT; #OSINT Domain Research; #SitDeck Tools.